Lasse Koskela
Accenture Technology Solutions
Copyright © 2004 Lasse Koskela.
You might have heard of the term code coverage. If not, this article will introduce you to this fine subject. We'll also take a look at some of the tools available for Java developers and how these tools fit into a build process using Ant.
Code coverage, in short, is all about how thoroughly your tests exercise your code base. The intent of tests, of course, is to verify that your code does what it's expected to, but also to document what the code is expected to do. Taken further, code coverage can be considered as an indirect measure of quality -- indirect because we're talking about the degree to what our tests cover our code, or simply, the quality of tests. In other words, code coverage is not about verifying the end product's quality.
So, how does code coverage differ from other types of testing techniques? Code coverage can be classified as white-box testing or structural testing because the "assertions" are made against the internals of our classes, not against the system's interfaces or contracts. Specifically, code coverage helps to identify paths in your program that are not getting tested. It is because of this distinction that code coverage shows its usefulness when testing logic-intensive applications with a lot of decision points (versus data-intensive applications which tend to have much less complex decision paths).
As always, there is more than one way to measure code coverage. We'll cover the essential measures under the broad scope of code coverage one by one, looking at where they're derived from and what do they tell to the developer. I have to warn you though: the list is long, and I have probably omitted plenty of existing code coverage algorithms out there. Furthermore, if you find my descriptions of the measures ambiguous or otherwise incomprehensible, I'm sure Google will help you in finding more thorough explorations on the details of each.
Statement coverage, also known as line coverage, is a measure which indicates the degree to which individual statements are getting executed during test execution. The statement coverage measure is possibly the easiest to implement considering that it can be applied over bytecode, which is a lot simpler to parse than source code having a touch of human handiwork in it. Statement coverage is also probably the most used by developers because it is easy to associate with source code lines -- "ah, that setter really doesn't get executed when my test calls it likes this!" However, the simplicity comes with a cost: statement coverage is unable to tell too much about how well you have covered your logic -- only whether you've executed each statement at least once. Here's an example of that problem:
/**
 * The statement coverage measure will report this method being fully covered
 * as long as we always call the method with condition true. In fact, if our
 * tests never call it with false, we have missed a serious runtime error
 * even though our code coverage was at 100 percent...
 */
public String statementCoverageSample(boolean condition) {
    String foo = null;
    if (condition) {
        foo = "" + condition;
    }
    return foo.trim();
}
There is a slight variation of the statement coverage measure called basic block coverage. Basic block coverage considers each sequence of non-branching statements as its unit of code instead of individual statements. This helps in overcoming such result-extorting scenarios where one branch of an if-else is much larger than the other -- statement coverage would easily report the coverage being close to 100% if the tests execute the significantly larger branch but never visit the smaller one.
/**
 * Assuming that our tests invoke this method only with condition false,
 * statement coverage would be approximately 98%, almost "perfect", if you will.
 * Yet, we have missed a small but very important branch and possibly
 * a source of lot of pain later on... Basic block coverage would consider each
 * branch "equal" and report a 50% coverage, indicating that there's probably
 * room for improvement in our tests.
 */
public void bigBranchSample(boolean condition) throws ApplicationException {
    if (condition) {
        System.out.println("Small branch #1");
        throw new ApplicationException("You should have tested me!");
    } else {
        System.out.println("Big branch #1");
        System.out.println("Big branch #2");
        System.out.println("Big branch #3");
        System.out.println("Big branch #4");
        ...
        System.out.println("Big branch #98");
    }
}
Decision coverage (also known as branch coverage) is a measure based on whether decision points, such as if and while statements, evaluate to both true and false during test execution, thus causing both execution paths to be exercised. Decision coverage is also relatively simple, which is both its pro and its con. The downside is that the measure doesn't take into consideration how the boolean value was gotten -- whether a logical OR was short-circuited or not, for example, leaving whatever code was in the latter part of the statement unexecuted.
if (amount > 100 || someCode() == 0) {
    // Did someCode() get executed? Decision coverage doesn't say...
    doSomething();
} else {
    doSomethingElse();
}
This deficit of the decision coverage measure is tackled to some degree by condition coverage, which extends the boolean evaluation of decision coverage into the sub-expressions (separated by logical ANDs and ORs) as well, making sure each of them is evaluated to both true and false. However, condition coverage is not a true superset of decision coverage because it considers each sub-expression independently, not minding about whether the complete expression is evaluated both ways. But wait, there's more. We have a measure called multiple condition coverage, which also takes into consideration the whole expression as well as the sub-expressions. This, however, often causes the number of required test cases to explode if the code under test employs complex boolean expressions. Making multiple condition coverage high does lead to thorough testing, but one really must consider whether the line of decreasing returns has been reached already...
Moving on, path coverage represents yet another interesting measure. Path coverage measures whether each possible path from start (method entry) to finish (return statement, thrown exception) is covered. Note that this is different from checking whether each individual decision is made both ways. Path coverage has its problems as well. For example, it is sometimes impossible to rate well with regard to path coverage if the code under test includes subsequent branching statements with such expressions that always evaluate the same -- it's impossible to test all theoretical combinations of those paths if the expressions have constraints with each other. The example below illustrates this problem. Another possible problem scenario is loops because they represent a huge range of possible paths (does this loop execute 0, 1, 5, or 1000 times?). There are some variations to the path coverage measure that try to tackle this problem, mostly by simplifying the problem to a manageable size, for example by considering loops to have only two possible paths; zero or more rounds (or one or more in the case of do-while).
/**
  * Path coverage considers this method having four possible paths but because
  * the branching is constrained into a single boolean, we can never execute
  * "A1, B2" or "B1, A2"
  */
public void pathCoverageSample(boolean foo) {
    if (foo) {
        System.out.println("Path A1");
    } // the else-branch would be "Path B1"

    // ...

    if (foo) {
        System.out.println("Path A2");
    } // the else-branch would be "Path B2"
}
Function coverage is a measure for verifying that each function (method) is invoked during test execution. In all its simplicity, function coverage is a very easy way to spot the biggest gaps in your code coverage.
One of the more advanced code coverage measures I though I should mention is race coverage, which considers multiple threads executing code simultaneously, thus, helping detect shared resource access problems. These types of measures are seldom used in other than testing software such as operating systems.
Still, we have relational operator coverage, which measures whether expressions with relational operators (<, <=, >, >=) in them are exercised with boundary values. For example, if the expression (a < 4) is executed with values of 2, 3 and 5, the relational operator coverage would report the expression as not covered -- the boundary value a == 4 was not tested. Yes, you guessed correct. This coverage was invented to catch those oh-so-common one-off errors...
So, after listing some of the different algorithms out there, "what are the ones I need to know," you might ask. "Which of those should I use?" Let me post-pone answering that one until later, ok? Let us just move on to what existing tools have to offer to us, and we'll get back to that question in the wrap-up.
Today, the developer community is in a relatively good situation regarding the availability of high-quality code coverage tools. We'll only take a look at a few, but there are lots more out there -- most are for sale, but some are free or even open source.
First, let's start by looking at how code coverage measures are generally implemented.
To my knowledge, the implementations can be categorized into two distinct implementation approaches:
So, we have some idea how the code coverage tools at our disposal. Are you itching to find out what kind of features these tools typically boast? (Except for running those boring algorithms, of course)
The feature sets, quality and usability of code coverage products vary significantly. I have listed here some of the most essential features from the point of view of usability.
Now that we've covered some of the core features in modern code coverage tools, let's take a look at how they fit into our existing Ant build script and what does the outcome look like.
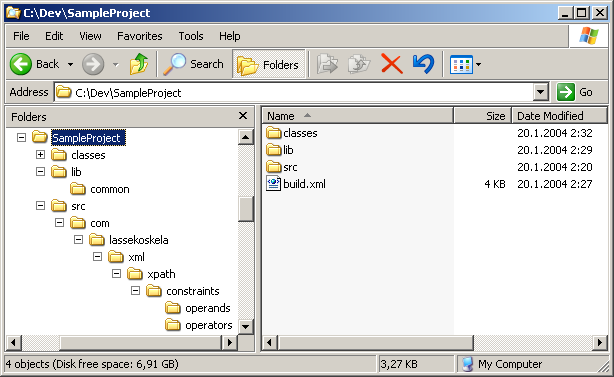
Our sample application is something I recently wrote on my spare time. The actual application, however, is of little importance. Our main focus is the structure of the project directory and the Ant build script, the build.xml file.
As you can see from the above screenshot, the project directory contains only three directories (of which "classes" is generated by the build) and one Ant script. The initial version of our Ant script, which we will extend by introducing three different code coverage tools, is listed below:
<project name="CodeCoverageArticle" default="all" basedir=".">

  <property name="src.dir" value="src"/>
  <property name="lib.dir" value="lib"/>
  <property name="lib.common" value="${lib.dir}/common"/>
  <property name="build.classes.dir" value="classes"/>

  <path id="compile.classpath">
    <fileset dir="${lib.dir}/common">
      <include name="*.jar"/>
    </fileset>
  </path>

  <path id="test.classpath">
    <pathelement location="${build.classes.dir}"/>
    <path refid="compile.classpath"/>
  </path>

  <target name="init">
    <mkdir dir="${build.classes.dir}"/>
  </target>

  <target name="compile" depends="init">
    <javac srcdir="${src.dir}" destdir="${build.classes.dir}" debug="true">
      <classpath refid="compile.classpath"/>
    </javac>
  </target>

  <target name="clean">
    <delete dir="${build.classes.dir}"/>
  </target>

  <target name="all" depends="clean, compile, test"/>

  <target name="compile.tests" depends="compile">
    <javac srcdir="${src.dir}" destdir="${build.classes.dir}">
      <classpath refid="test.classpath"/>
    </javac>
  </target>

  <target name="test" depends="compile.tests">
    <junit printsummary="true">
      <classpath location="${build.classes.dir}"/>
      <classpath refid="test.classpath"/>
      <batchtest fork="yes" todir="${reports.tests}">
        <fileset dir="${src.dir}">
          <include name="**/*Test*.java"/>
          <exclude name="**/AllTests.java"/>
        </fileset>
      </batchtest>
    </junit>
  </target>

</project>
Regardless of which of the three demonstrated products are used, there are a number of similarities that can be handled uniformly, separating the minor details from the actual code coverage tasks. The common changes to our initial build.xml are as follows:
I've highlighted the changes in the following, extended version of our Ant script:
<project name="CodeCoverageArticle" default="all" basedir=".">

  <property name="src.dir" value="src"/>
  <property name="lib.dir" value="lib"/>
  <property name="lib.common" value="${lib.dir}/common"/>
  <property name="build.classes.dir" value="classes"/>

  <property name="build.instrumented.dir" value="instrumented"/>
  <property name="coverage.toolname" value="XXXXX"/>
  <property name="lib.coverage" value="${lib.dir}/${coverage.toolname}"/>
  <property name="reports.dir" value="reports"/>
  <property name="coverage.report" value="${reports.dir}/${coverage.toolname}"/>

  <path id="compile.classpath">
    <fileset dir="${lib.dir}/common">
      <include name="*.jar"/>
    </fileset>
  </path>

  <path id="coverage.classpath">
    <fileset dir="${lib.coverage}">
      <include name="*.jar"/>
    </fileset>
  </path>

  <path id="test.classpath">
    <pathelement location="${build.instrumented.dir}"/>
    <pathelement location="${build.classes.dir}"/>
    <path refid="compile.classpath"/>
    <path refid="coverage.classpath"/>
  </path>

  <target name="init">
    <mkdir dir="${build.classes.dir}"/>
    <mkdir dir="${build.instrumented.dir}"/>
    <mkdir dir="${reports.dir}"/>
  </target>

  <target name="compile" depends="init">
    <javac srcdir="${src.dir}" destdir="${build.classes.dir}" debug="true">
      <classpath refid="compile.classpath"/>
    </javac>
  </target>

  <target name="clean">
    <delete dir="${build.classes.dir}"/>
    <delete dir="${build.instrumented.dir}"/>
    <delete dir="${reports.dir}"/>
  </target>

  <target name="all" depends="clean, compile, test"/>

  <target name="compile.tests" depends="compile">
    <javac srcdir="${src.dir}" destdir="${build.classes.dir}">
      <classpath refid="test.classpath"/>
    </javac>
  </target>

  <target name="test" depends="compile.tests">
    <junit printsummary="true">
      <classpath location="${build.instrumented.dir}"/>
      <classpath location="${build.classes.dir}"/>
      <classpath refid="test.classpath"/>
      <batchtest fork="yes" todir="${reports.tests}">
        <fileset dir="${src.dir}">
          <include name="**/*Test*.java"/>
          <exclude name="**/AllTests.java"/>
        </fileset>
      </batchtest>
    </junit>
  </target>

</project>
The only thing left to do is the tool-specific part, the proprietary Ant tasks for performing the instrumentation and reporting at suitable stages of the build process. This is what the following sections are focused on.
Clover is a commercial code coverage tool, which has the market leader status. There was a time when Clover was light-years ahead of others, but the competition has gotten tougher lately. Clover is still very much a top dog when it comes to code coverage and it has had most of its rough edges removed within the past couple of years. (Although Clover is commercial, it is possible to apply for a free license if you're an open source project or another not-for-profit organization!)
So, let's see what kind of additions was needed in order to get Clover up and running! The following snippet of build-clover.xml illustrates what this last step means in the case of Clover. I have commented the targets and tasks where I saw the need to.
  <!--
    - These definitions cause Ant to load the Clover Ant tasks and the types it uses
    -->
  <taskdef classpathref="coverage.classpath" resource="clovertasks"/>
  <typedef classpathref="coverage.classpath" resource="clovertypes"/>

  <!--
    - This is the instrumentation step. Clover uses a data file ("cloverdata/coverage.db")
    - for storing the coverage data collected during test execution, as well as
    - a data directory ("cloverdata/history") for storing the historical traces needed
    - for report generation.
    -->
  <target name="instrument">
    <mkdir dir="cloverdata/history"/>
    <mkdir dir="${build.instrumented.dir}"/>
    <clover-setup initstring="cloverdata/coverage.db"
                  tmpdir="${build.instrumented.dir}"
                  preserve="true">
      <files> <!-- instrument only application code, not test code -->
        <exclude name="**/*Test.java"/>
        <exclude name="**/AllTests.java"/>
      </files>
    </clover-setup>
  </target>

  <!--
    - This is the reporting step. For the "current" task, Clover reads the coverage
    - data file ("cloverdata/coverage.db") and produces a HTML report to the
    - specified directory. For the "historical" task, Clover mines the history
    - storage directory ("cloverdata/history") and produces a nice HTML graph
    - to the specified directory.
    -->
  <target name="report">
    <clover-historypoint historyDir="cloverdata/history"/>
    <clover-report>
      <!--
        - Generate the "regular" code coverage report.
        -->
      <current outfile="${coverage.report}/coverage">
        <fileset dir="${src.dir}">
          <exclude name="**/*Test.java"/>
          <exclude name="**/AllTests.java"/>
        </fileset>
        <format type="html"/>
      </current>
      <!--
        - Generate a code coverage history report.
        - Note that this step will fail until you have run the regular
        - report at least twice (i.e. until you have enough data as
        - the history)
        -->
      <historical outfile="${coverage.report}/history"
                  historyDir="cloverdata/history">
        <format type="html"/>
        <overview/>
        <coverage/>
        <metrics/>
        <movers/>
      </historical>
    </clover-report>
  </target>

  <!--
    - This is the "main" target to run when you want a code coverage report
    - being generated. The sequence of dependency targets indicates the stage
    - where each Clover-task is performed. Note that instrumentation is
    - performed *before* compiling the sources!
    -->
  <target name="runcoverage" depends="clean, instrument, compile, test, report"/>
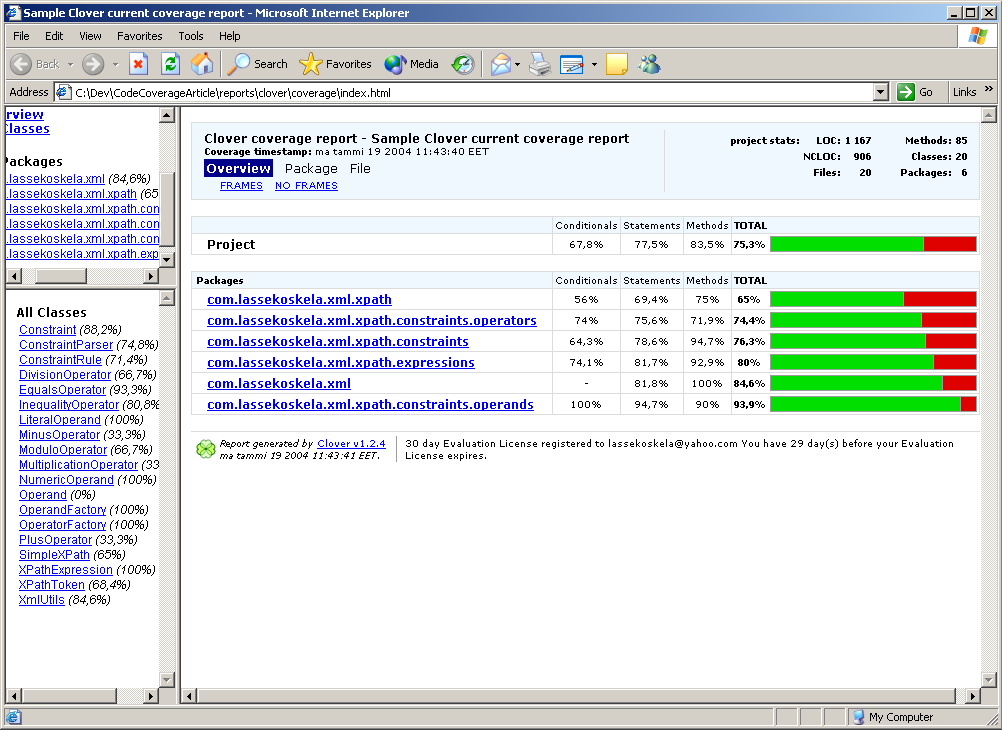
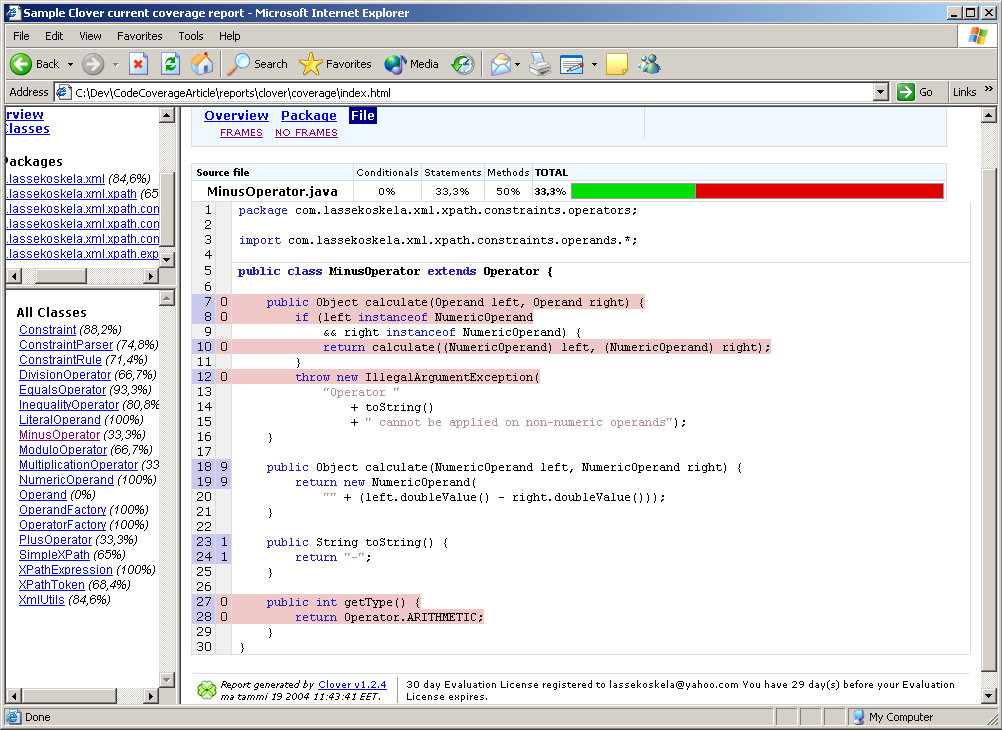
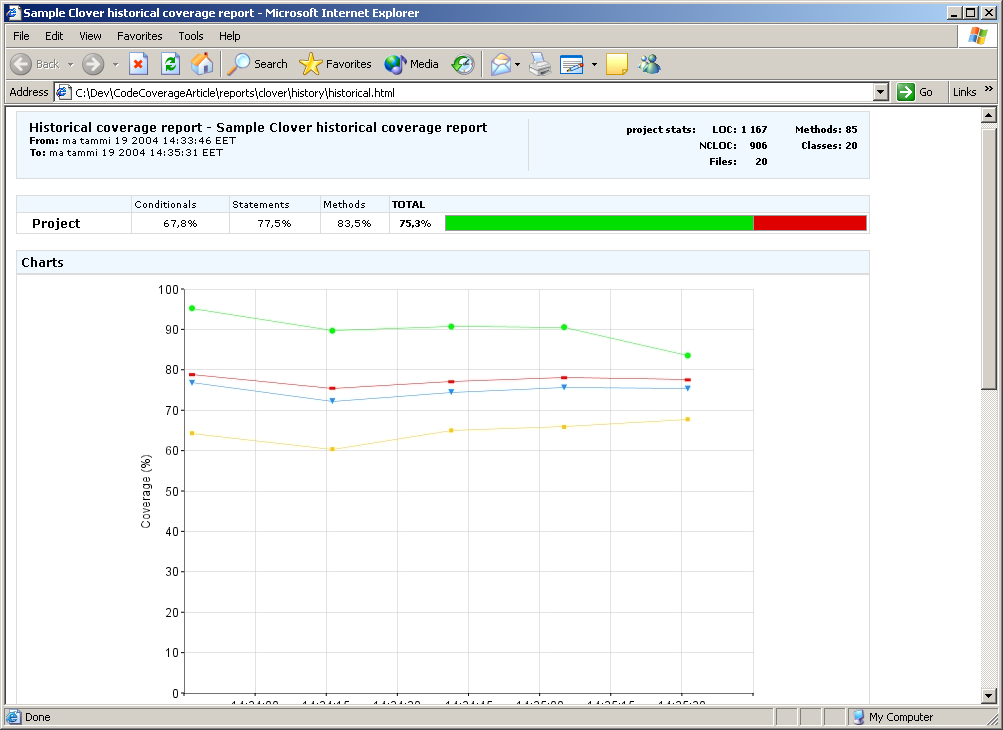
That's it. Not too complicated, is it? Finally, here's what the reporting target spits out:
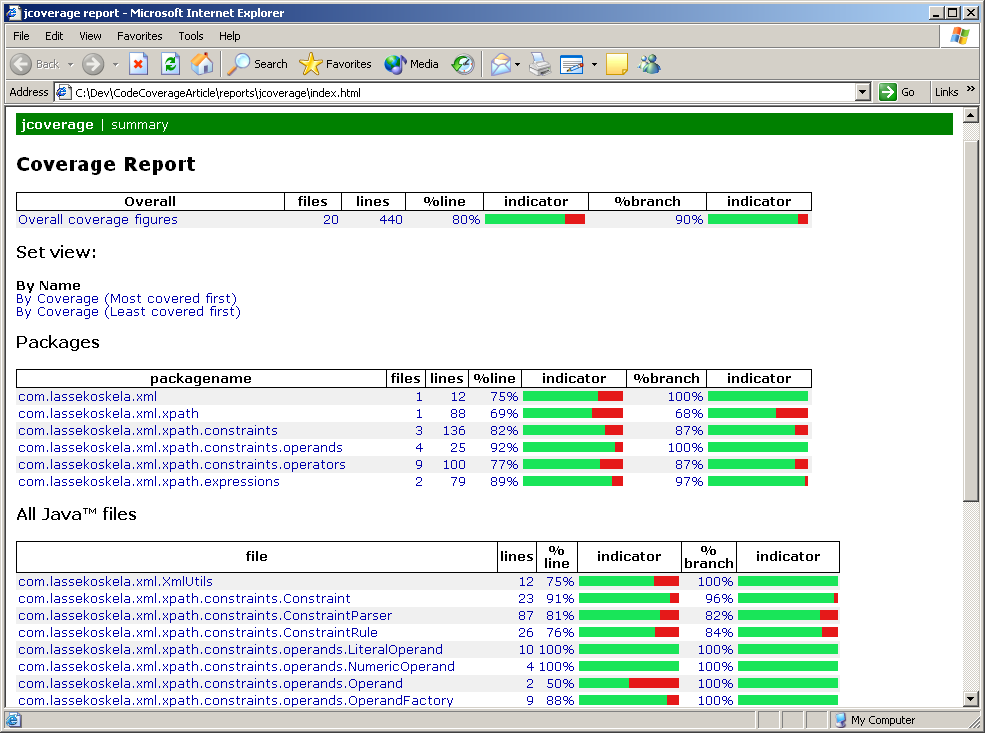
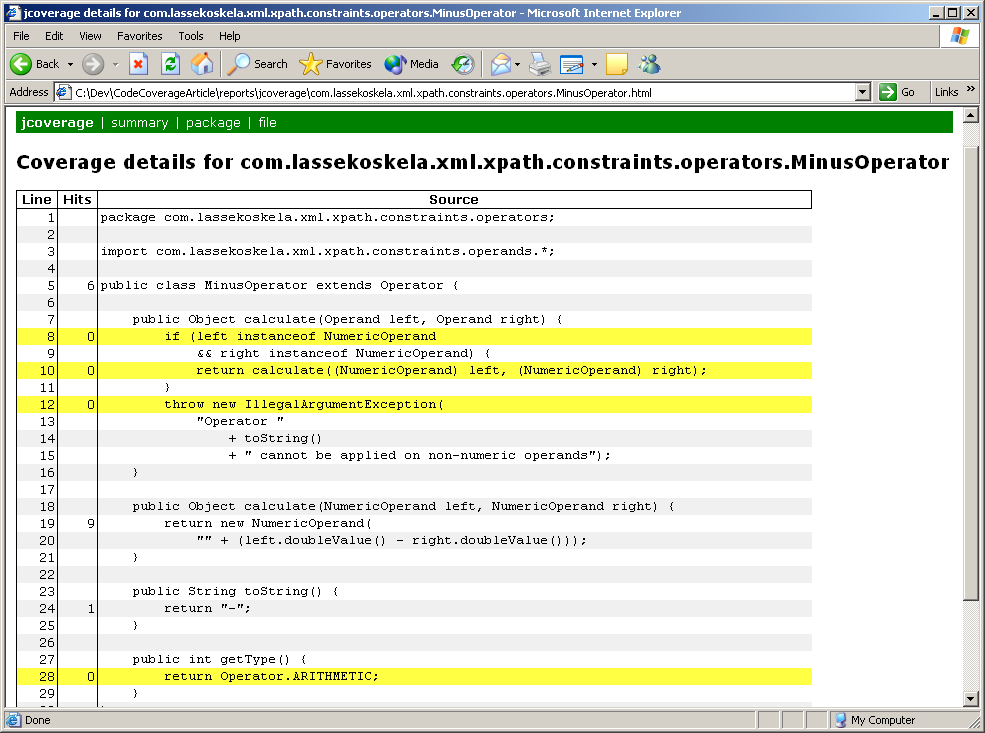
JCoverage is a code coverage tool developed by a company with the same name. There are different editions of JCoverage, each of them adding some kind of "advanced" features over the core code coverage functionality, which is available with a GPL license. The feature set and usability of JCoverage is top-notch, which makes it a considerable contender against Cortex eBusiness' Clover -- especially with its GPL licensed version.
Again, what follows is an annotated snippet of what needs to be added into our generic build script:
  <!--
    - These definitions cause Ant to load the JCoverage Ant tasks
    -->
  <taskdef classpathref="coverage.classpath" resource="tasks.properties"/>

  <!--
    - This is the instrumentation step. JCoverage uses a data file
    - ("jcoverage.ser" by default) for storing the coverage data collected
    - during test execution
    -->
  <target name="instrument">
    <!--
      - Instrument the specified files into the given directory.
      -->
    <instrument todir="${build.instrumented.dir}">
      <ignore regex="org.apache.log4j.*"/>
      <fileset dir="${build.classes.dir}">
        <include name="**/*.class"/>
        <exclude name="**/*Test.class"/>
        <exclude name="**/AllTests.class"/>
      </fileset>
    </instrument>
  </target>

  <!--
    - This is the reporting step. For the "current" task, Clover reads the coverage
    - data file ("cloverdata/coverage.db") and produces a HTML report to the
    - specified directory. For the "historical" task, Clover mines the history
    - storage directory ("cloverdata/history") and produces a nice HTML graph
    - to the specified directory.
    -->
  <target name="report">
    <report srcdir="${src.dir}" destdir="${coverage.report}"/>
    <report srcdir="${src.dir}" destdir="${coverage.report}" format="xml"/>
  </target>

  <!--
    - This is the "main" target to run when you want a code coverage report
    - being generated. The sequence of dependency targets indicates the stage
    - where each JCoverage-task is performed. Note that instrumentation is
    - performed *after* compiling the sources because JCoverage relies on
    - bytecode manipulation!
    -->
  <target name="runcoverage" depends="clean, compile, instrument, test, report"/>
As you can see, JCoverage's Ant tasks are slightly easier to use than Clover's relatively complex tasks.
Next, HTML reports a la JCoverage:
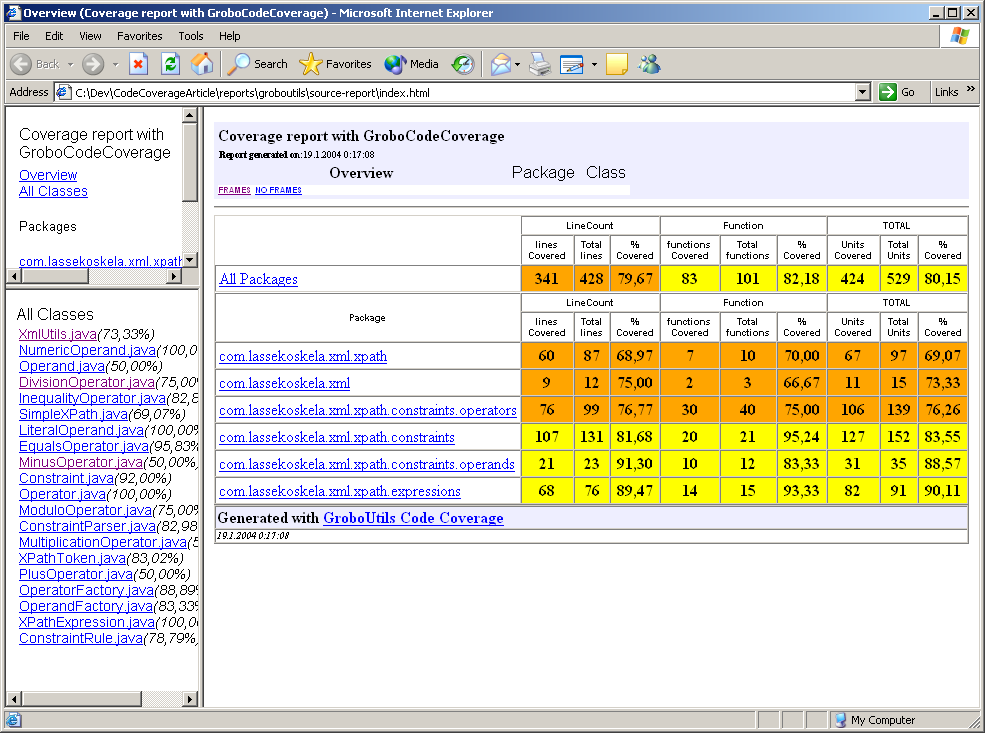
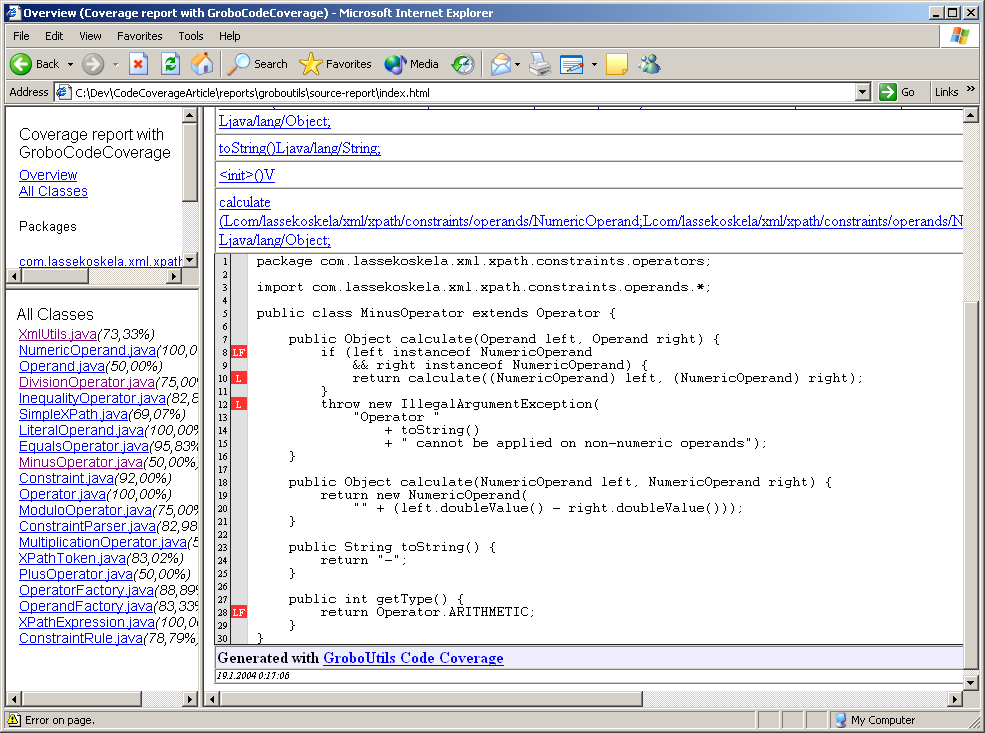
The third and last of our example code coverage tools is the code coverage module of the GroboUtils open source project hosted at SourceForge. GroboUtils is still a bit rough in the edges, but has gone through some major developments lately in the hands on the lead developer, Matt Albrecht. These rough edges show up as slightly more complicated Ant integration, a rugged look and feel of the generated HTML reports, and significantly slower execution of the build script. Regardless of these disadvantages, GroboUtils is likely to soon become a serious competitor and is something to keep an eye out for.
First, here's the additional part to our Ant script:
  <!--
    - These definitions cause Ant to load the GroboUtils Ant tasks
    -->
  <taskdef resource="net/sourceforge/groboutils/grobocoverage.properties">
    <classpath refid="coverage.classpath"/>
  </taskdef>

  <!--
    - This is the instrumentation step. GroboUtils uses directories
    - for storing the coverage data collected during test execution.
    - The included coverage algorithms (linecount, function) are specified
    - for the instrumentation task at this stage.
    -->
  <target name="instrument">
    <mkdir dir="${coverage.report}/data"/>
    <mkdir dir="${coverage.report}/logs"/>
    <coveragepostcompiler datadir="${coverage.report}/data"
                          outclassdir="${build.instrumented.dir}">
      <fileset dir="${build.classes.dir}">
        <include name="**/*.class"/>
        <exclude name="**/*Test.class"/>
        <exclude name="**/AllTests.class"/>
      </fileset>
      <analysismodule name="linecount"/>
      <analysismodule name="function"/>
      <logsettings logdir="${coverage.report}/logs"/>
    </coveragepostcompiler>
  </target>

  <!--
    - This is the reporting step. GroboUtils reads the coverage data directory
    - data and processes report generator XSL stylesheets in order to
    - generate the report, which in our case happens to be the one that
    - includes source code linking ("sourcestyle").
    -->
  <target name="report">
    <coveragereport datadir="${coverage.report}/data"
                    logdir="${coverage.report}/logs"
                    outdir="${coverage.report}">
      <sourcestyle destdir="${coverage.report}/source-report"
                   removeempty="true" srcdir="${src.dir}"
                   title="Coverage report with GroboCodeCoverage"/>
    </coveragereport>
  </target>

  <!--
    - This is the "main" target to run when you want a code coverage report
    - being generated. The sequence of dependency targets indicates the stage
    - where each GroboUtils-task is performed. Note that instrumentation is
    - performed *after* compiling the sources because GroboUtils relies on
    - bytecode manipulation!
    -->
  <target name="runcoverage" depends="clean, compile, instrument, test, report"/>
And here's what the outcome looks like:
Well, well. We've covered quite a bit of ground regarding code coverage tools for Java development. We've discussed some algorithms used to produce measures of code coverage and we have quickly enumerated the ways that code coverage tools are generally implemented. We also saw how a number of code coverage tools can be integrated to an Ant build script and what kind of reports these tools can produce.
So, back to the question, "what are the code coverage measures I should use?"
The answer is, I can't say. Each tool supports a different subset of the algorithms and each tool has its own little accent. The best advice I can give you regarding the use of code coverage as part of your development practices is, whatever you do, do it consistently. In other words, pick any combination that sounds good, and stick with them. You'll see everything you need to see by looking at how the green bar progresses -- how exactly is the length of that bar calculated is a minor detail. Code coverage analysis is not a silver bullet but simply an alarm bell. And sometimes it might ring without reason.
I hope you enjoyed reading this. If you found code coverage analysis to be something you might benefit from, check out one of the tools I've listed in Resources and have a go at it.
As I know you're itching to get started, I've gathered all the necessary links to spare you some time and let you get on with the scratching ;)