by Mark Spritzler
In order to debug server-side code you must start your (app) server in debug mode, and you must have your IDE connect to the remote JVM through a Remote Server Debug configuration (That's what it is called in IDEA). Other IDE's should have something very similar to this that will allow it to "hook" into the remote JVM and find out the calls that are being made, and to stop the code when it hits a breakpoint that you have set in the IDE.
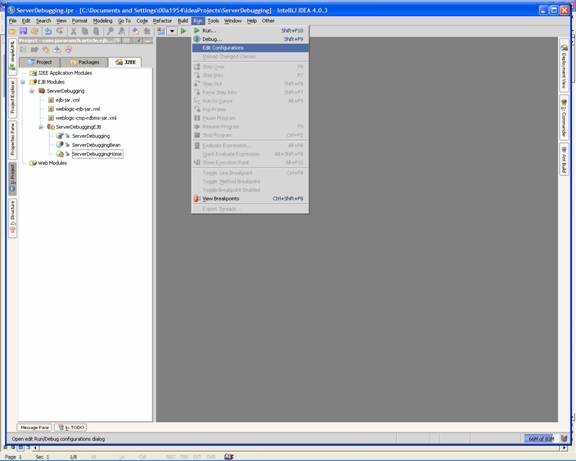
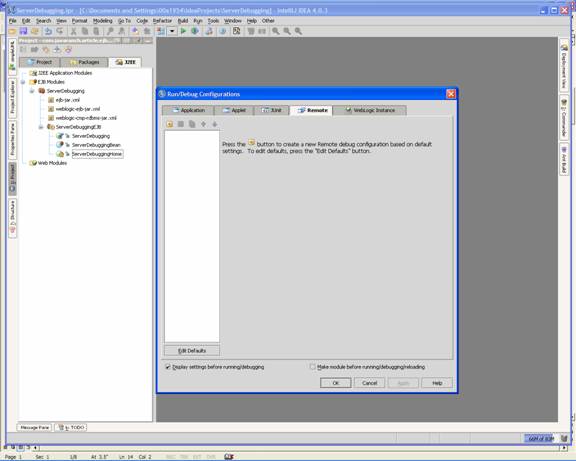
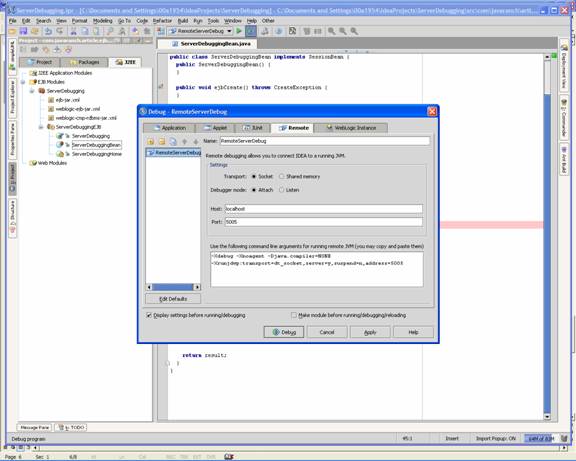
How to create a "Remote Server Debug configuration".
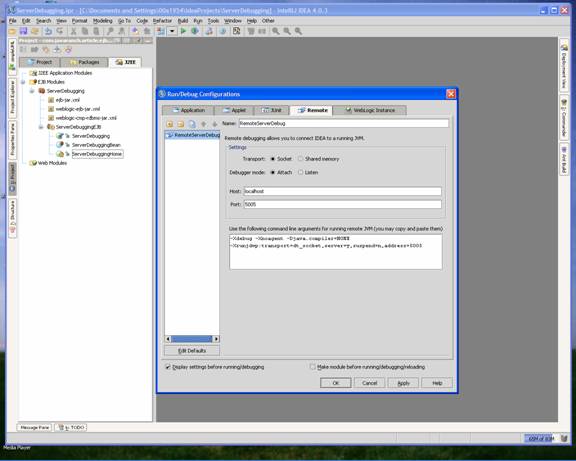
This command line is what is needed to start the Application Server in debug mode, see "To set the server to startup in debug mode."
To set the server to startup in debug mode.
-Xdebug -Xrunjdwp:server=y,transport=dt_socket,address=5005,suspend=n
This code is a little different than what you get from IntelliJ, but when I was setting up my machine, I ran into a problem and using the above worked for me. However, I would try using what you get from IntelliJ IDEA first, as that is what should be in the JAVA_OPTIONS.
Example of the commEnv.cmd file where JAVA_OPTIONS is listed
set JAVA_OPTIONS=%JAVA_OPTIONS% -Xverify:none -Xdebug -Xrunjdwp:server=y,transport=dt_socket,address=5005,suspend=n
After changing the file, start or restart your App Server. When it restarts it will be in debug mode.
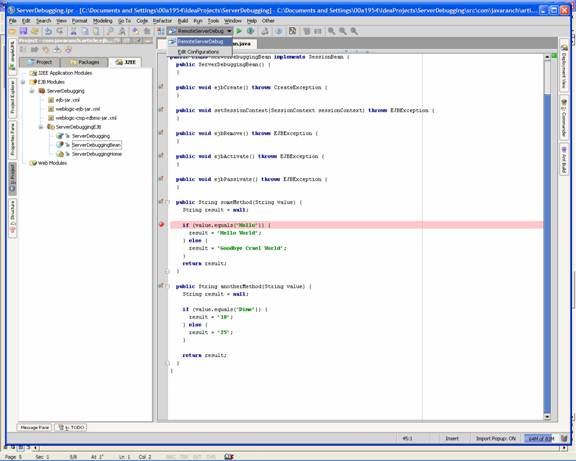
Setting a breakpoint and watching IntelliJ IDEA stop the code in action. J
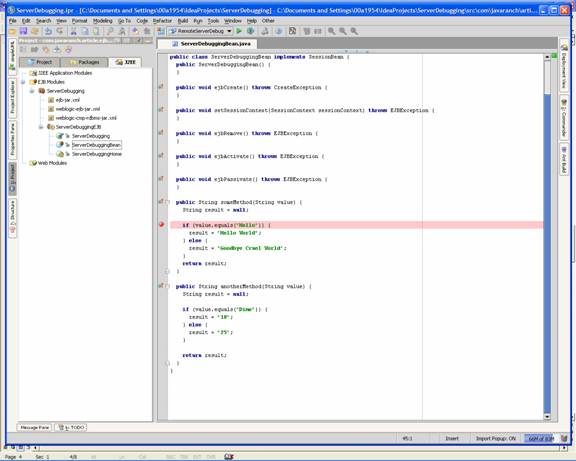
As you can see the red ball/dot on the left of the code is a breakpoint.
Congratulations, see now wasn't that simple. J
Debugging on other IDEs.
Now that we have covered how to set up and start a debugging session with IntelliJ IDEA and Weblogic server, lets talk about the other IDEs, like Eclipse, and Netbeans, and other Web Servers like JBoss and Websphere.
These are just as simple. The configuration is almost identical. The only difference is what names they call their debugging configuration, in the case of the IDEs and which text configuration file the App server stores the call to the java command to start their server, and then include the –X parameters to that line.
In Eclipse, their debug configuration is called "Remote Java Application" which you will see after clicking the Green bug button on the toolbar. And just like in IntelliJ IDEA< you just give it a meaningful name. In IntelliJ IDEA, their Java_options for the server uses port 5005, but in Eclipse it is set for port 8000. Don't worry about this, as it is just a formality, and the only worry would be that you choose a port that is already in use. Either one of these ports will work fine for your configuration, they just have to match from on both sides.
Restart your app server, set a breakpoint, and run your program in a DOS prompt, and bingo, you are stepping through code.
For more information on your IDE or App Server, please check their respective websites and other documentation. Now that you know the basics, it shouldn't be hard to find more specific information. It is one of Murphy's law, that you can't find the information you want when you need it, but after you figure it out, you find the information everywhere.
Good Luck and happy debugging. May all your bugs be easy to find.